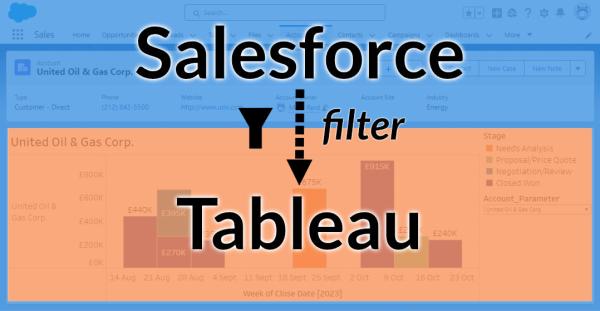
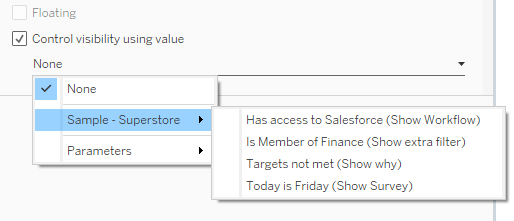
In this follow-up blog post on Embedding Tableau views within Salesforce, I walk through two options for passing filters from the Salesforce UI to Tableau to improve the user experience and ensure your embedded dashboards are showing relevant information.
Preview Tableau Dashboards in Google Docs
One of the new features in version 2023.3 of Tableau is the ability to use Google smart chips within Google Docs to show a preview of a Tableau Cloud visualisation. What are Google smart chips? Google smart chips are a way to provide a preview to other content, such as appointments, contacts, maps and more.... Continue Reading →
Dynamically Change Axis Start and End Values
The new Dynamic Axis Ranges feature in v2023.3 enables you to change the chart axis start and end values based on parameters. Combined with parameter actions, this makes your dashboards more dynamic based on user interaction.
Multiple Values and Wildcard Match Tableau Filters
Have you ever wanted to filter a Tableau dashboard to a list of values that you can copy & paste from a spreadsheet or other source? This is actually possible without any hacks using a Multiple Values (custom list) filter. This short blog post shows you how.
Tableau Outline Spatial Function
Version 2023.2 of Tableau adds two new spatial functions: OUTLINE and SHAPETYPE. This post introduces the OUTLINE function with a few example use cases including the use of set actions and map layers.
Dashed and Dotted Line Patterns
This post takes a quick look at this new formatting feature shipping in version 2023.2 enabling the use of dotted and dashed lines.
Dynamic Field Formatting in Tableau
How do you currently format dynamic measure fields in Tableau? This post explores three new functionality ideas to make dynamic formatting easier.
Tableau Image Role + Cloudinary
The new image role feature makes using images in headers super easy. Adding the Cloudinary image service makes those headers dynamic and data driven. This post explores how.
Intersects Spatial Function
The new INTERSECTS() spatial function, introduced in 2022.4, makes it possible to determine if two spatial objects overlap without needing to perform a spatial join. This post walks through a few examples with points, polygons (buffers) and lines.
Dynamic Zone Visibility Dashboard
This post steps through my approach - and the calculations used - for creating a dashboard that shows different charts based on five different analysis scenarios by using the dynamic zone visibility feature.
Dynamic Zone Visibility
The new Dynamic Zone Visibility feature in version 2022.3 opens up a variety of possibilities for dynamically customising dashboards, showing or hiding charts, filters, images, text, containers and more based on calculations, parameters and the selections of marks.
Creating Multiple Axes without Duplicating Marks
Two approaches to creating multiples axes in your charts without duplicating the number of marks in the view.
Tableau Custom Number Formatting – Part 2
Part 2 of this custom number formatting post covers: large numbers, prefixes & suffixes, currency, localisation and Unicode with many examples.
Adding a Dynamic Reference Line to Viz-in-Tooltips
This post shows you how to change the default behaviour of viz-in-tooltips, removing the filter and adding a dynamic reference line using a parameter action.
Creating Flight Paths in Tableau
This tutorial video steps through how to create flight path maps in Tableau using spatial functions including MAKEPOINT, MAKELINE and DISTANCE.
Buffer Functions and Spatial Joins
This video walks through how to perform spatial analysis by creating a spatial join between multiple data source with the help of various spatial functions, such as Buffer, MakePoint and Distance.
Spatial Joins in Tableau
Spatial joins can help you explore geographic relationships between different sources of spatial data. This blog and video walk through an example in Tableau.
Map Layers with Multiple Data Sources
In this video, I step through how to use map layers in version 2021.4 to create a three-layer map with polygons, lines and points and also how to use the different map layer options.
Show only Selected Countries in a Background Map
This blog shows how you can use MapBox to create a custom background map that only shows a filtered set of countries.