
One of the new features in version 2023.3 of Tableau is the ability to use Google smart chips within Google Docs to show a preview of a Tableau Cloud visualisation.
What are Google smart chips?
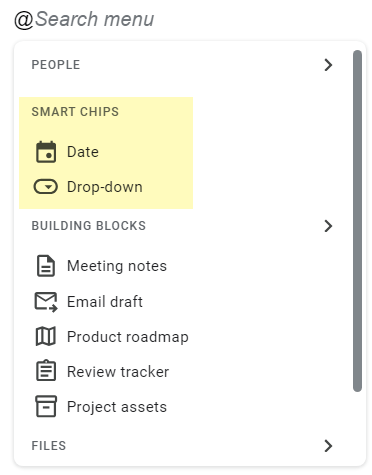
Google smart chips are a way to provide a preview to other content, such as appointments, contacts, maps and more. They’re usually created by typing @ in a Google doc and then selecting an option from the menu.
You can also add other types of smart chips by typing. For example, if you type a location, say “Salesforce London”, a list of places will show.
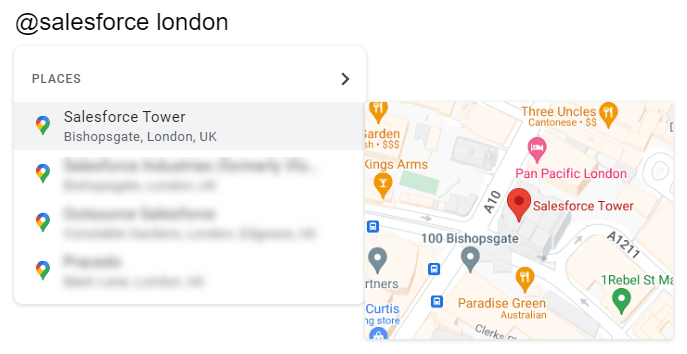
Selecting “Salesforce Tower” inserts a Google Maps smart chip into the document, which you can then hover over to see the map:
Preview Tableau Dashboards in Google Docs
Tableau has created a Google Docs extension that, once installed, allows you to preview dashboards directly from Tableau Online directly within your Google document.
Simply paste in a link to a dashboard on Tableau Online and a pop-up will show, indicating that the link has been recognised as a Tableau Online link. Press tab to convert the link to a smart chip. You can then hover over the smart chip (or highlight it using the shift and arrow keys on the keyboard) and the dashboard preview will appear:
Here’s another example showing multiple dashboard previews.
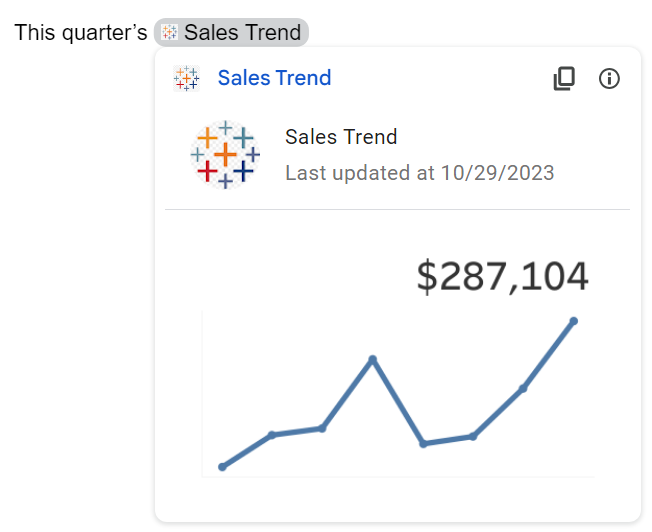
And one more using a small dashboard that can then be displayed as a KPI / metric card in a Google doc
Setup and Security
The extension makes use of Connected Apps and Personal Access Tokens in Tableau Online. The high-level setup is as follows:
- Create a connected app in Tableau online
- Create a Personal Access Token (PAT)
- Install the Tableau Cloud Google Workspace extension
- Authenticate via the Tableau Google Workspace Add-on Manager (using you PAT)
- Once logged in, add your connected App details and save.
For full setup details, see this page on Tableau’s GitHub site.
Summary
While not a game changer, this is definitely a nice-to-have feature. When referencing dashboard links in documentation, these visual previews will help readers recall if that is a dashboard they’ve used before without having to open the dashboard. In a report, summary KPI dashboard links could be used to provide up-to-date metrics on key figures along with a trend.
In general, it’s good to see Salesforce opening up more ways to access insights from Tableau – along with, for example, being able to see dashboards directly in Slack and embedded in Salesforce. All of which help to keep consumers in the flow of work without switching between applications unnecessarily.
Be notified of new content…
If you find these Tableau tips and tutorials useful, you can follow me on LinkedIn for all the latest content.
Thanks,
Marc
The recent release of Tableau 2024.1 includes an update to spatial buffers and you can now create these buffers around line string objects.
Click here to learn more…

