
The introduction of ‘Show/Hide Containers’ and ‘Parameter Actions’ in the Tableau 2019.2 beta opens up some interesting possibilities for the user experience.
We now have the option to create a custom user interface for interacting with dashboard elements, including parameters, that in turn drive elements of the dashboard, such as the measures shown, colour, size and labels etc.
Furthermore, charts can now be displayed on demand in a popup floating container anywhere on the dashboard. These floating containers do not have to hold charts, however. They can also contain elements that trigger parameter actions and set actions that in turn customise the charts in the view.
Popup Charts in Action
The below video shows an example of this:
How Does It Work?
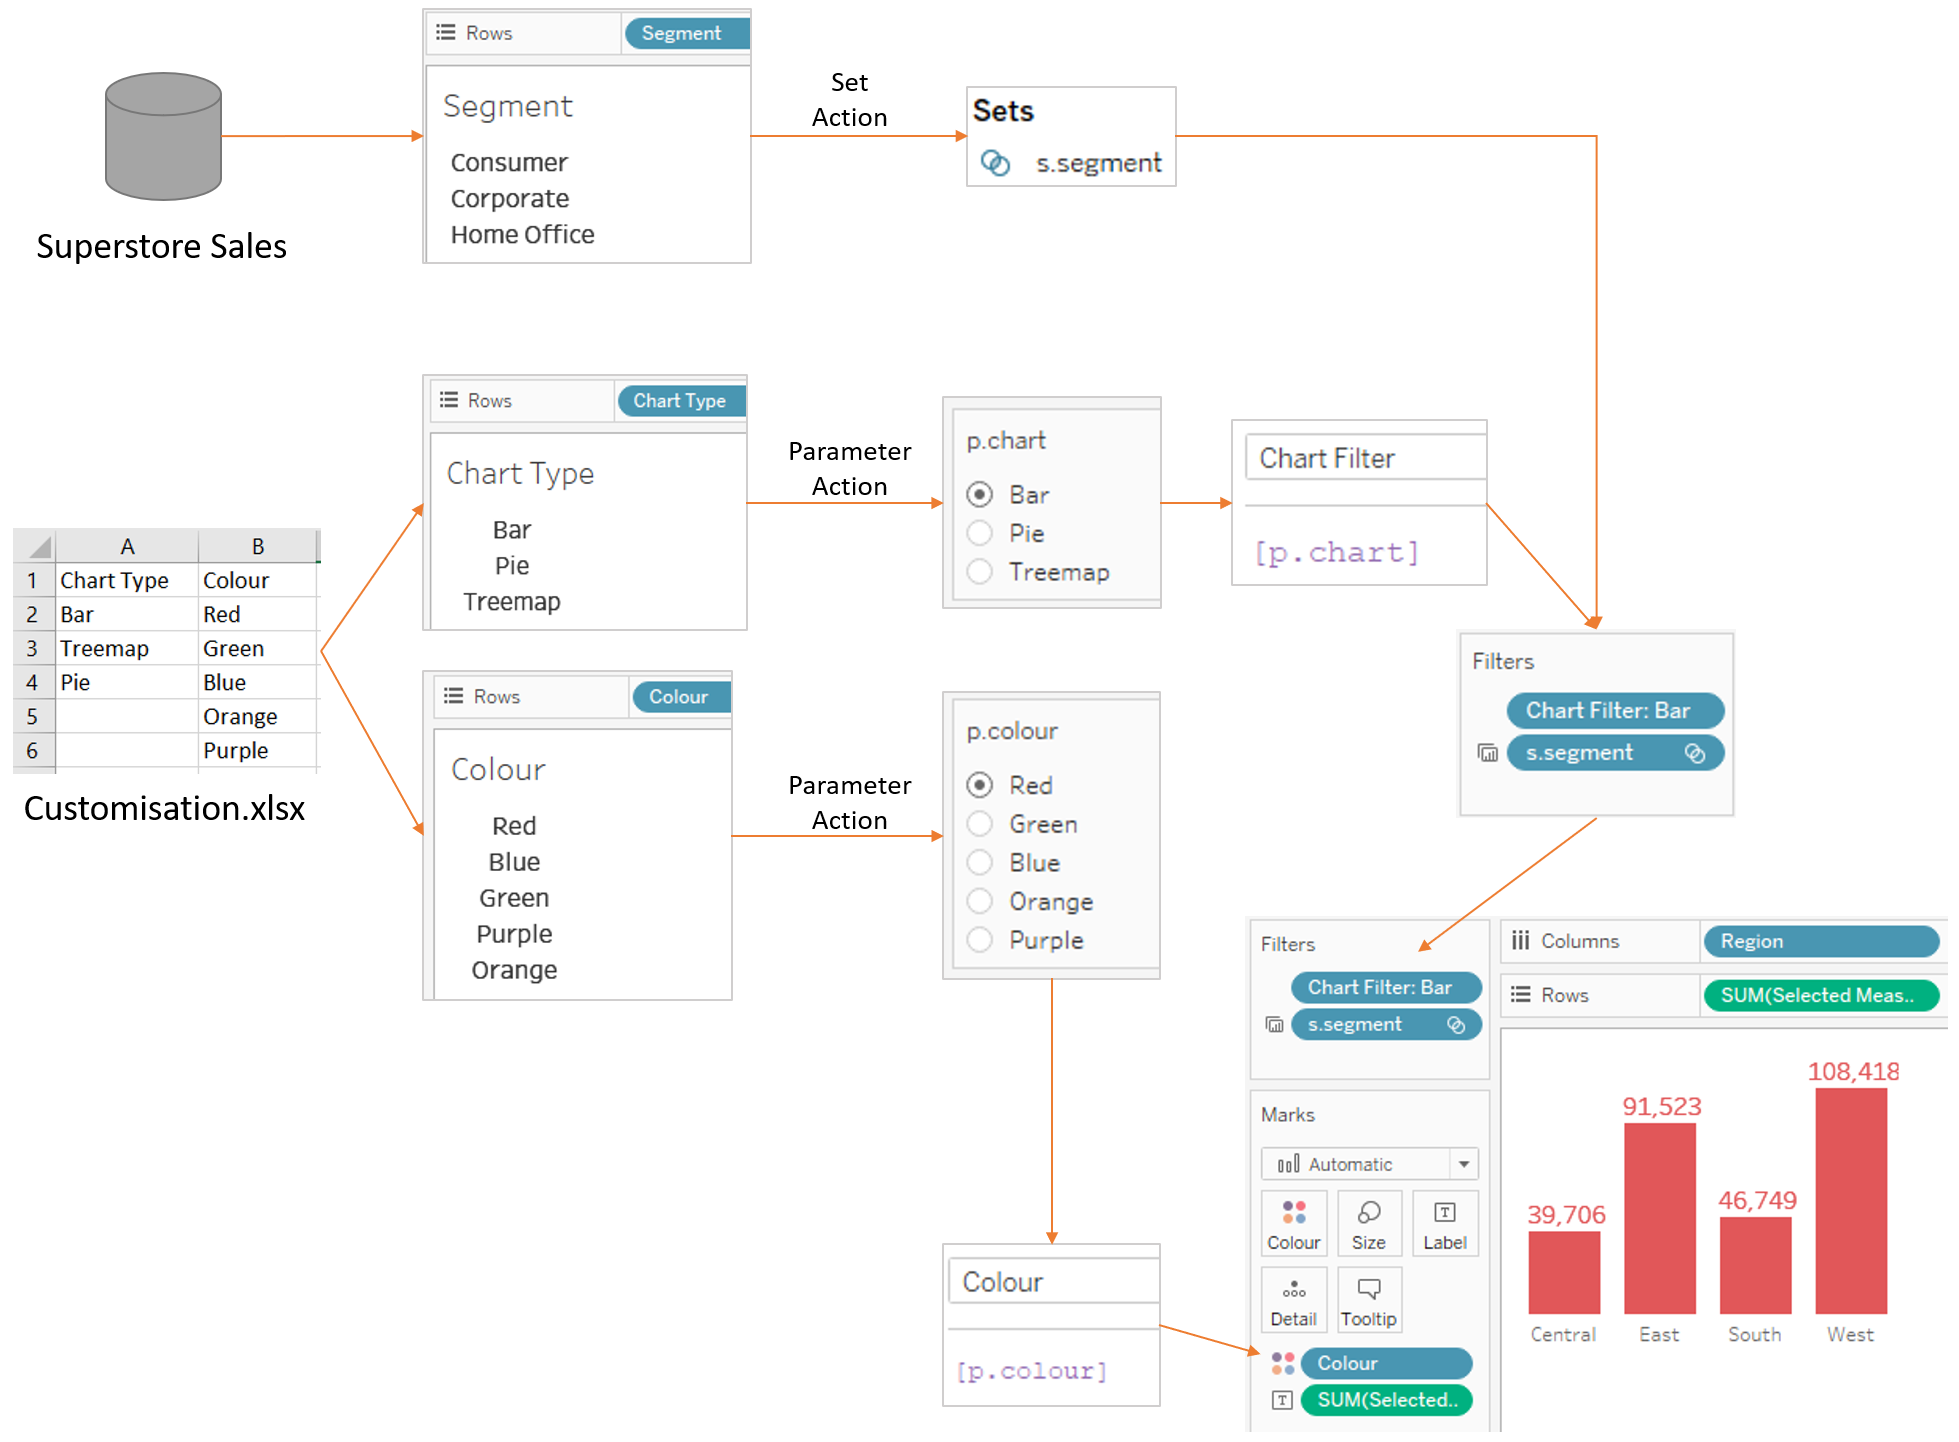
To talk through the full building of this workbook would be quite long winded, so instead I created a flow diagram which hopefully helps communicate the elements of the workbook and the interaction between them.
Dashboard Setup
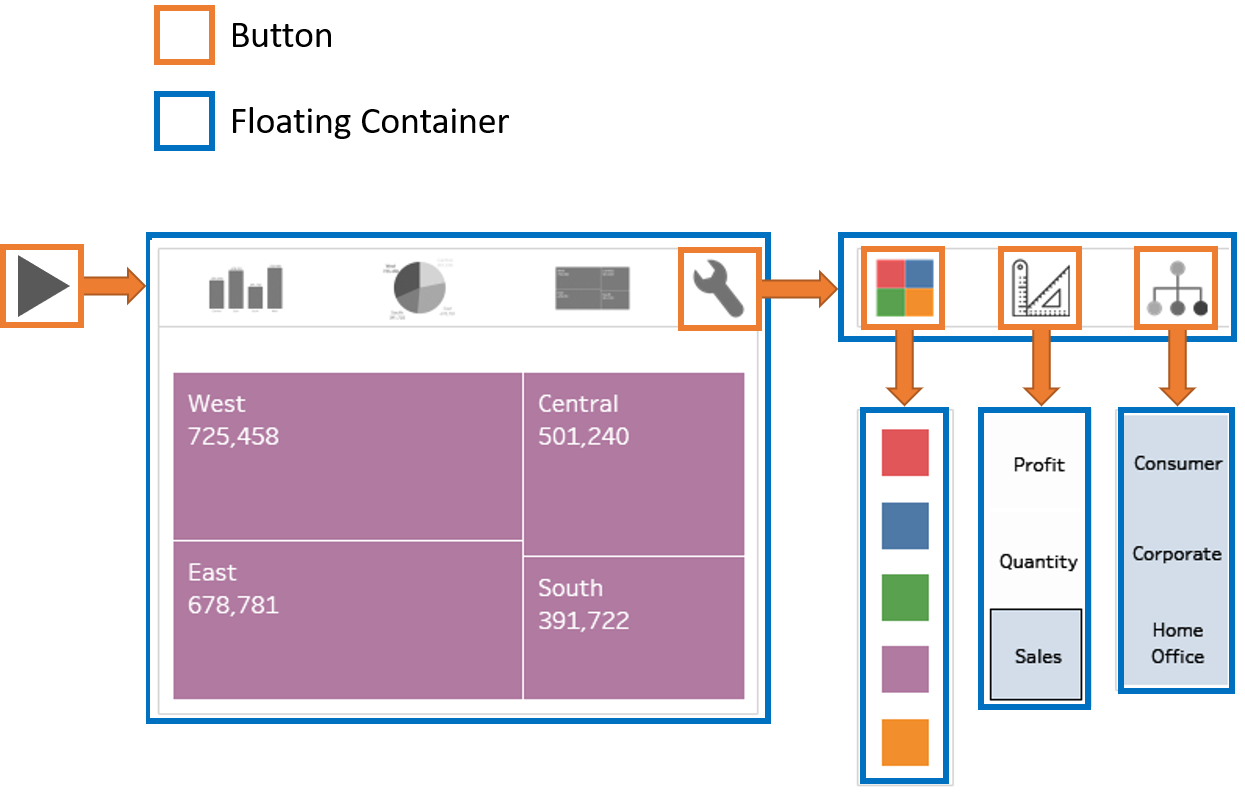
The below image shows how the dashboard is structured – the floating containers (with a blue border) and their respective toggle buttons (with an orange border).
Notes on the Build
Below are some notes to help explain the first diagram:
- All values required for a parameter are in a separate data source – Customisations.xlsx
- Any field from the above source can be put onto its own worksheet to show all its values, which can then drive a parameter action
- The main point is that parameters are not tied to one data source, so any data source can be used to set/change a parameter value and that parameter can then be used on any other worksheet (inside a calculation) that uses any other data source. There doesn’t need to be any connection between the data sources (via blending or joining)
- Where customisation of a field from the main data source is needed, such as ‘Segment’ in this example, this is taken from the main data source and used on a sheet to drive a set action.
- The above set is then put on the filter shelf of all 3 charts on the dashboard
- The sheet switching is done via a parameter and filter, which is explained in detail here. The only difference is instead of clicking a drop down parameter, the interface has the elements of the parameter on a sheet that then update the parameter via a parameter action
Hopefully that all makes sense. But if you have any questions, feel free to ask them in the comments below and I’ll do my best to answer.
Be notified of new content…
If you find these Tableau tips and tutorials useful, you can follow me on LinkedIn for all the latest content.
Thanks,
Marc
The recent release of Tableau 2024.1 includes an update to spatial buffers and you can now create these buffers around line string objects.
Click here to learn more…

