At first sight, a 50 column table in Tableau can be a bit daunting. Just seeing all those blue pills makes me feel a bit uneasy.

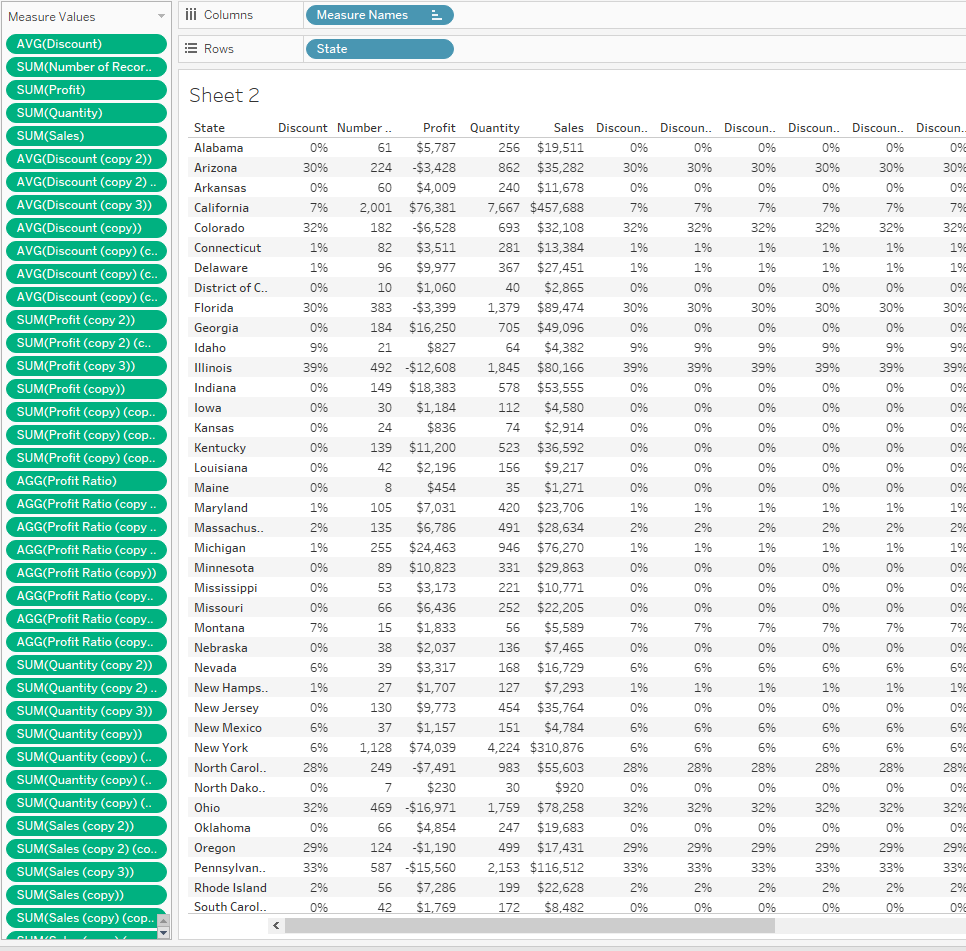
Technically, we can already create 50 or more column tables in Tableau by using Measures Names and Measure Values, however, the number of dimensions allowed on the Rows shelf is restricted to 16. The additional columns are measures not dimensions – e.g. below:
The new functionality in the 2019.4 beta allows you to put 50 dimensions, which are usually (but not always) blue pills, on the Rows shelf as shown in the GIF at the top of this page.
In some ways, this new feature can feel like a step in the wrong direction – isn’t Tableau all about visualisation? charts, graphs etc.? – but, ultimately, I think it makes sense.
Why would you need 50 columns?
Large tables aren’t the best method of visualisation to find trends in your data, however, if you’ve spent time with a range of stakeholders, discussing their reporting and analytics requirements for new dashboards, it’s likely some of the following will have come up in conversation:
- I need to be able to see and export all the data
- I need to be able to lookup a specific value for any row in my data
- There’s a regulatory requirement to produce a report with 50 fields
- I get ad-hoc one-off questions that can’t be answered with the existing selected (16) columns in the table on my dashboard.
One step at a time…
If large tables are a non-negotiable requirement for many people, which presumably they are or Tableau wouldn’t have built the feature, then it makes sense to make this possible to enable people to start using the product. Then, with the right training and guidance, people can begin to take advantage of the more powerful, visual and interactive ways of seeing and understanding their data.
Improved Sorting
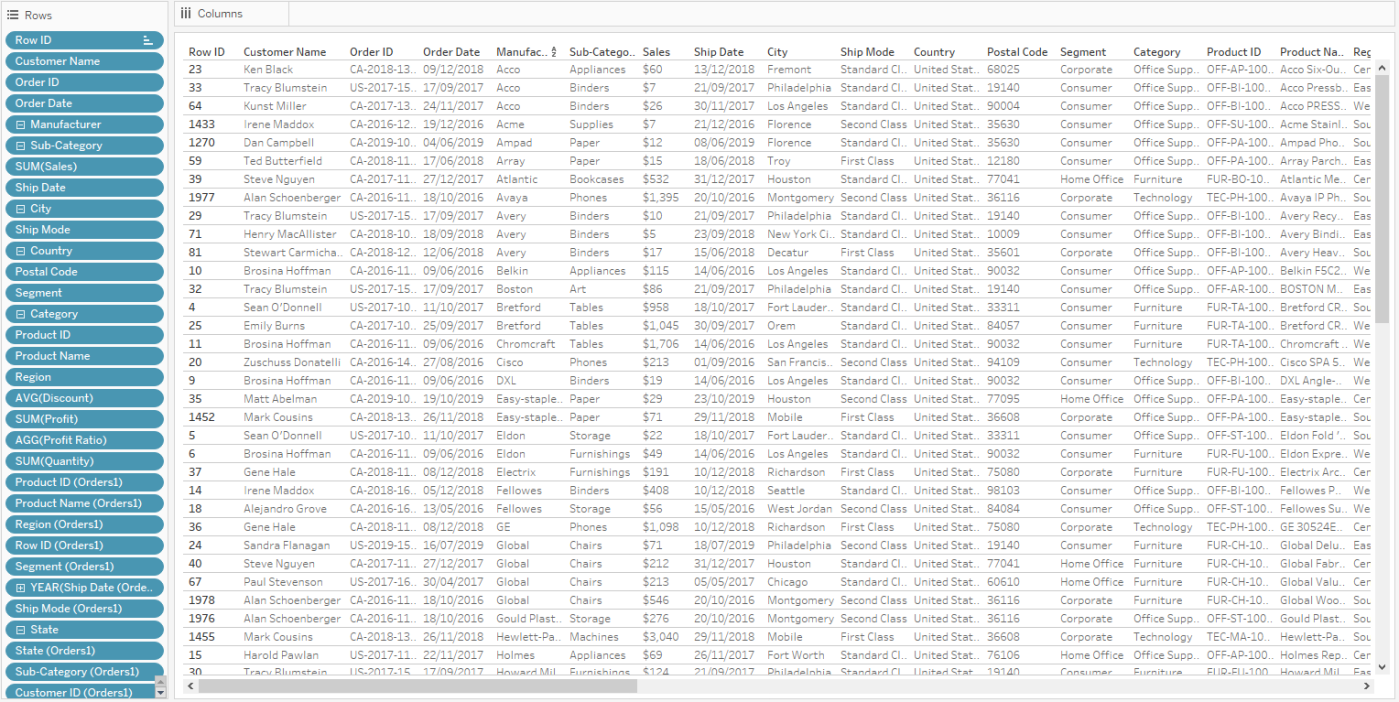
A welcome new feature to tables in the 2019.4 beta is the ability to sort the entire table (across panes) by any dimension or discrete measure in the table by directly clicking on the sort icon in the header of the column:

It’s important to note that this sorting functionality will only work if you have a unique field (per row) in the leftmost column, such as Row ID in the above example.
If we swap the unique field, Row ID, with Customer Name, which is repeated for multiple rows, then the sorting will only work within each pane (the group of rows for each Customer Name), as below:

Horizontal Scrolling
In the current version of Tableau, 2019.3, you can only scroll in the measures section of the view. If you have many dimensions in a table view, the rightmost dimensions or your measures might not be visible without resizing the columns to be very narrow:

In the 2019.4 beta, the scroll bar now works across the entire table, measures and dimensions, so you can scroll to the right to see your extra dimensions and measures:

To learn more about new features coming to Tableau soon, take a look at Tableau’s ‘coming soon’ page here: https://www.tableau.com/products/coming-soon
Be notified of new content…
If you find these Tableau tips and tutorials useful, you can follow me on LinkedIn for all the latest content.
Thanks,
Marc
The recent release of Tableau 2024.1 includes an update to spatial buffers and you can now create these buffers around line string objects.
Click here to learn more…


Leave a comment