
This week’s #WorkoutWednesday visualised the number of orders per week and the size of those orders based on the Sum of Sales, all in a chart that looks like a row of trees. I like the original design and look of these charts.
I first filtered the data to 2018 and then built out a first draft of the chart using a dual axis – one mark as bars for the ‘trunk’ (centre line) of the tree and a second as circles, using a Count Distinct of Order IDs as the measure for both axes, with Segment on Rows:

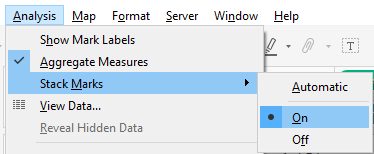
The issue with this build is that the circles were overlapping. So I forced the marks to stack by changing this setting to On:
This got me a lot closer. Note, I also wrapped the Segment in an UPPER() formula to make it all caps per Ann’s design, as well as renaming the axis to “# ORDERS”:

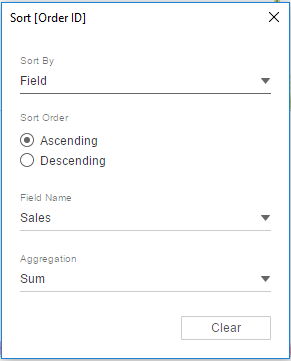
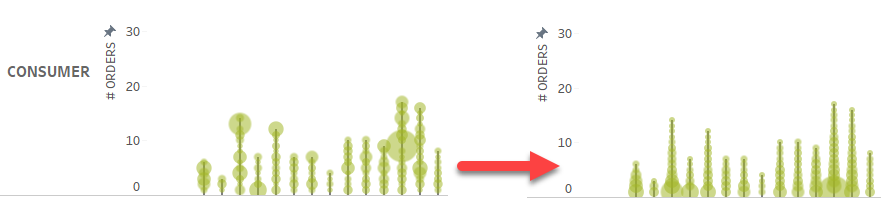
It was then necessary to sort the Order IDs so the largest order (by Sum of Sales) was at the base of the ‘tree’:
This had the following effect and seemed to match to the requirements across all the Segments:
Viz in Tooltip
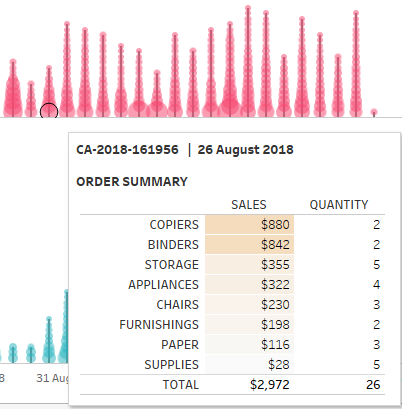
For this challenge, when hovering over one of the orders, a table should show with a breakdown of the Sub-Categories that make up that order along with the Sales and Quantity of each Sub-Category. For example:
The layout for the ViTT was fairly straightforward, but the colouring required separate colour legends to be used. The final layout I used is below:

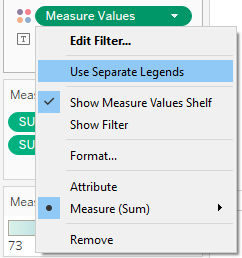
To get the separate legends for Measure Values, this can be selected from the drop down menu of the Measure Values pill that is on the Colour shelf:
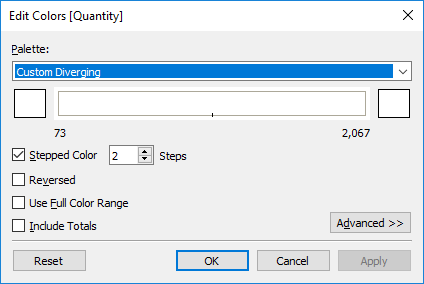
For the Sales measure I used a Custom Sequential orange palette (white to orange). As there shouldn’t be any colour showing on the Quantity column, I used a Custom Diverging palette, but selected both ends of the palette to be white, as below:
And, with some final formatting and tidy up, I think I’m done:

Thanks for reading and if you have any questions, please let me know!
Be notified of new content…
If you find these Tableau tips and tutorials useful, you can follow me on LinkedIn for all the latest content.
Thanks,
Marc
Learn Tableau and other data & AI skills via the link below.

Note: The link above is an affiliate link, which means I may earn a small commission if you decide to sign up — at no extra cost to you. It helps support the running of this site.

Leave a comment