This week’s #MakeoverMonday provided a small data set that summarised some of the events around these two large events – Chinese New Year and Thanksgiving – that take place in China and the USA respectively.
The Data
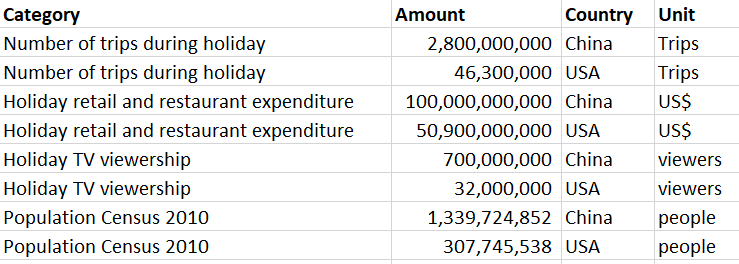
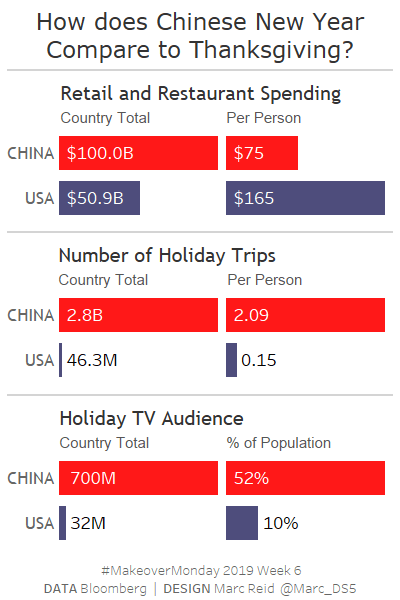
The original visualisation, from Statistica, showed the numbers in their actual, non-normalised form, which gives a sense of the scale of the total spending or total activity (number of trips taken, for example). However, I found this a bit hard to digest from a personal perspective.
From Aggregate Numbers to Per Person Metrics
I was curious to know what these numbers meant for the individuals in each country:
- How much did each person spend (in retail and restaurants)?
- How many trips to each person take?
- What percentage of the population watched the main TV events for each occasion?
Fortunately the total populations for the USA and China were also in the data set, so it was a fairly simple case of dividing the metrics by the respective country populations to get per capita metrics.
Mobile Design
I don’t often create mobile designs so this was a good opportunity, given the relatively small data set and the simple comparisons I wanted to make.
I decided to keep the original aggregate data for context of the scale of the two events and add the per-person metrics to give an appreciation for how each ‘category’ affected individuals in each country. Click the image to open in Tableau Public:

Be notified of new content…
If you find these Tableau tips and tutorials useful, you can follow me on LinkedIn for all the latest content.
Thanks,
Marc
Learn Tableau and other data & AI skills via the link below.

Note: The link above is an affiliate link, which means I may earn a small commission if you decide to sign up — at no extra cost to you. It helps support the running of this site.

Leave a comment