
The Parameter Actions feature in the first beta release for 2019.2 allowed you to click on a single mark in the view and have the value of that mark (for a specified measure or dimension) transferred to a parameter for use in your visualisation, such as in reference lines, calculations, or directly in titles and text boxes.
The beta 2 release for 2019.2 has enhanced this functionality and now allows you to select multiple marks in the view, from which a single value aggregate of the selected marks is passed to a designated parameter to be used as before. When configuring the Parameter Action, you select which aggregation to use, which can be any of the following – depending on the data type of the measure or dimension you are passing the value from and the data type of the receiving parameter:
- Sum
- Average
- Minimum
- Maximum
- Median
- Count
- Count (Distinct)
- Standard Deviation
- Standard Deviation (Population)
- Variance
- Variance (Population)
Text Field to a Text Parameter
To give an example, if the value I want to pass is from the text dimension “Sub-Category” and the data type of my parameter is also text, the following aggregations will be available:
- None
- Min
- Max
This can be seen in the screenshot below:

Minimum would pass the value from the selected sub-categories that would be first in an alphabetical sort. For example, if I selected “Furnishings” and “Appliances”, then “Appliances” is the value that would be passed to my text parameter. Maximum would work work the opposite way.
The aggregation of None simply won’t pass any value if multiple marks are selected and will only pass a value if a single mark is selected in the view.
Text Field to Numeric Parameter
If, however, the value I am passing is still from the Sub-Category field, but now my parameter is numeric, the following aggregations are available:
- Count
- Count (Distinct)
As can be seen below:

Selecting Count will pass the numeric count of Sub-Categories that I select in the view and Count (Distinct) will pass the distinct count of Sub-Categories selected to the numeric parameter.
Non-Matching Data Types
If the data type of the parameter does not correlate with any matching aggregations for the fields in the view then the list of available fields is None and the action cannot be created with that parameter. This can be seen with a Boolean parameter below where the only field I have in the view is the text field sub-category:

Updating Summary Metrics and Reference Lines
Using these new actions, we can update multiple summary metrics and reference lines on the dashboard by making a selection, as demonstrated in the below video:
One Selection Can Trigger Multiple Actions
Similar to other action types, such as Filter Actions, more than one action can be triggered by a single interaction. In the above example, fourteen parameter actions are triggered by making one selection of marks in the view! Below are all the actions used to update all the summary metrics and reference lines in the dashboard:

What’s great about Parameter Actions – and makes them easier and quicker to use than Set Actions – is that they can be used without any calculations. So, in this example I have updated six reference lines (3 horizontal and 3 vertical) based on 3 different aggregations (MIN, MAX and AVG) for both Sales (on the X axis / Columns shelf) and Profit (on the Y axis / Rows shelf), by simply specifying the parameter as the ‘Value’ when creating the reference lines:

In the above example “p.MAX Y” is the name of my parameter and below is the configuration for the Parameter Action that passes the maximum SUM(Profit) value of the selected marks to my parameter:
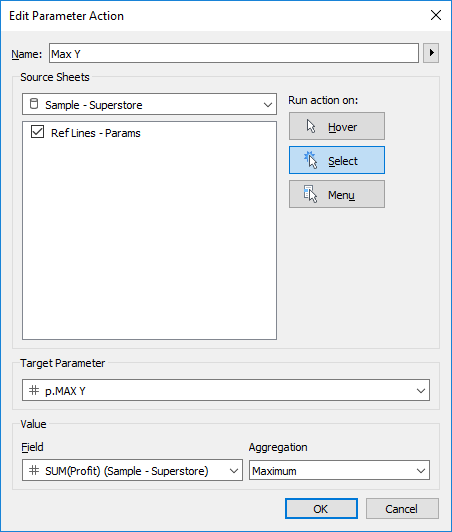
So the “calculation” is contained within the Parameter Action configuration dialogue box using the drop down menus.
For the summary metrics at the bottom and right hand side of the screen, I decided to pass the parameter values into corresponding calculated fields so that I could use Measure Names / Values to build the two views
The below image shows the flow of data for one of the 14 Parameter Actions:

- Multiple marks are selected
- A Parameter Action is triggered, which passes the maximum SUM(Profit) value to the parameter “p.MAX Y”
- A calculated field called “MAX” takes the value of the parameter
- The calculated field is then used in a view as part of Measure Values to display various summary metrics for the range of Profit values selected
I hope this blog has been useful in introducing Parameter Actions. They are a great addition to the product and will really increase the levels and types of interactivity that are possible in Tableau. Roll on 2019.2!
Be notified of new content…
If you find these Tableau tips and tutorials useful, you can follow me on LinkedIn for all the latest content.
Thanks,
Marc
The recent release of Tableau 2024.1 includes an update to spatial buffers and you can now create these buffers around line string objects.
Click here to learn more…

